New York Metropolitan Transportation Council
The NYMTC SED Dashboard allows users to interactively visualize county-level socioeconomic and demographic data in the NYMTC region.
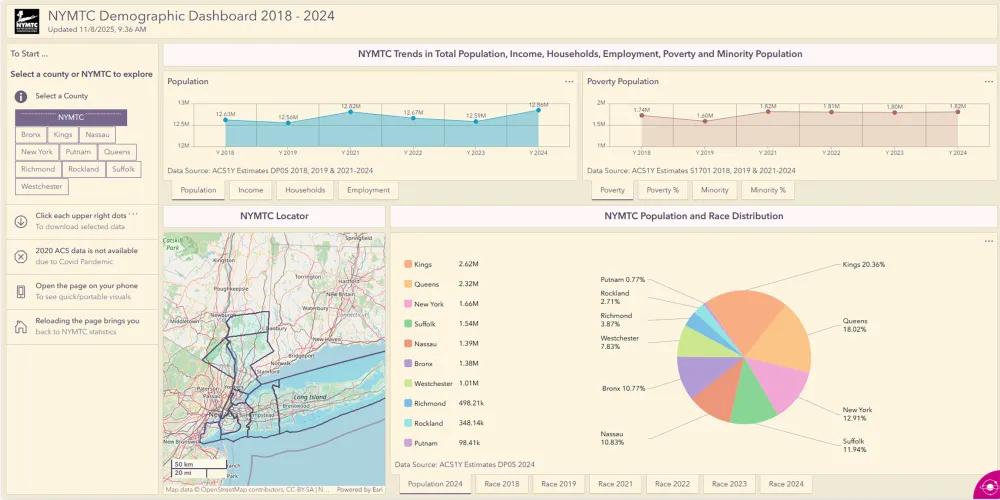
The NYMTC SED Dashboard allows users to interactively visualize county-level socioeconomic and demographic data in the NYMTC region. The dashboard includes data and trends related to population, income, households, employment, poverty, minority, and racial groups.
Image